
What is the ATR?
The Average True Range (ATR) is a volatility indicator that measures the degree of price movement in an asset over a specified period. Developed by J. Welles Wilder in his 1978 book "New Concepts in Technical Trading Systems," the ATR helps traders understand how much an asset's price is likely to fluctuate, providing insight into market volatility. Unlike other indicators that focus on direction, the ATR is purely about measuring volatility.
How Does the ATR Work?
The ATR is calculated by taking the greatest of the following three values:
- The current high minus the current low.
- The absolute value of the current high minus the previous close.
- The absolute value of the current low minus the previous close.
These values represent the "true range" for the period. The ATR is then calculated as the moving average of the true range over a specified number of periods, typically 14.
The formula for the ATR is:
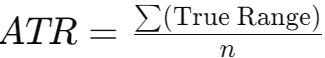
Where "n" is the number of periods.
Why Use the ATR in Cryptocurrency Trading?
The cryptocurrency market is known for its high volatility, making the ATR a particularly valuable tool for traders. By providing a clear measure of how much an asset's price is moving, the ATR can help traders set appropriate stop-loss levels, manage risk, and identify potential breakouts or reversals.
ATR Trading Strategies
1. Setting Stop-Loss Levels with ATR
One of the most common uses of the ATR is to set stop-loss levels that account for market volatility. Traders can use the ATR to determine a safe distance for their stop-loss orders, ensuring they don't get stopped out due to normal market fluctuations.
Practical Example: Suppose you're trading Bitcoin, and the ATR is 200 points. A trader might set a stop-loss at a distance of 1.5 to 2 times the ATR value (300 to 400 points away from the entry price) to account for potential volatility.
2. ATR Breakout Strategy
Another effective strategy is the ATR breakout strategy, where traders look for periods of low ATR values followed by a sudden increase in volatility. This can indicate the beginning of a new trend or breakout.
Bullish Breakout: Occurs when the price breaks above a resistance level with a rising ATR, indicating strong momentum behind the move.
Bearish Breakout: Occurs when the price breaks below a support level with a rising ATR, indicating strong momentum behind the move.
How to Read the ATR
The ATR is displayed as a line on a chart, with higher values indicating greater volatility and lower values indicating less volatility. Traders often use the ATR in combination with other indicators to make informed decisions about entry, exit, and risk management.
- High ATR Values: Indicate increased market volatility and potential for larger price movements.
- Low ATR Values: Indicate reduced market volatility and potential for smaller price movements.
Comparing ATR with Other Volatility Indicators
While the ATR is a pure measure of volatility, other indicators like Bollinger Bands and the Standard Deviation also provide insight into market volatility. However, the ATR's simplicity and focus on price movement rather than direction make it a unique and valuable tool, particularly for setting stop-loss levels and managing risk in volatile markets like cryptocurrencies.
Frequently Asked Questions About the ATR
What is a good ATR value to use? The ATR value itself is relative and varies depending on the asset being traded. Traders typically use the ATR to set stop-loss levels or identify breakout opportunities, rather than as a direct buy or sell signal.
Can the ATR be used in all markets? Yes, the ATR is versatile and can be used in various markets, including cryptocurrencies, forex, and stocks. Its effectiveness may vary depending on market conditions and the specific strategy being used.
Is the ATR better than Bollinger Bands? The ATR and Bollinger Bands serve different purposes. The ATR is a straightforward measure of volatility, while Bollinger Bands provide a range within which the price is likely to fluctuate. The choice between them depends on the trader's strategy and market conditions.
ATR Applications in Forex and Stock Trading
While this article focuses primarily on cryptocurrencies, the ATR is also widely used in forex and stock trading. In forex, the ATR helps traders set appropriate stop-loss levels based on the volatility of currency pairs. In the stock market, the ATR can be used to assess the volatility of individual stocks or indices, helping traders manage risk and identify potential breakout opportunities.
Conclusion: The ATR as a Key Volatility Indicator
The ATR is an essential tool for any trader, whether operating in cryptocurrencies, forex, or stocks. Its ability to measure market volatility and provide insight into potential price movements makes it a valuable indicator for managing risk and identifying trading opportunities.