What are Bollinger Bands?
Bollinger Bands are a popular technical analysis tool used to measure market volatility and identify potential buying or selling opportunities. Developed by John Bollinger in the 1980s, Bollinger Bands consist of a simple moving average (SMA) in the middle, with two standard deviation lines (bands) plotted above and below it. These bands expand and contract based on market volatility, providing traders with insights into price action and potential reversals.
How Do Bollinger Bands Work?
Bollinger Bands are composed of three lines:
- Middle Band: This is typically a 20-period Simple Moving Average (SMA) of the asset's price.
- Upper Band: This is the middle band plus two standard deviations.
- Lower Band: This is the middle band minus two standard deviations.
The formula for Bollinger Bands is:
- Upper Band: Middle Band + (2 × Standard Deviation)
- Lower Band: Middle Band - (2 × Standard Deviation)
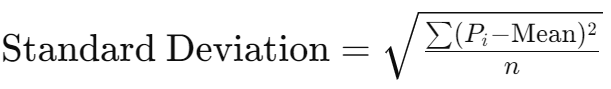
The standard deviation is a measure of volatility, meaning that when the market is more volatile, the bands widen, and when the market is less volatile, the bands contract.
The formula used for Standard Deviation, which is necessary to calculate the Bollinger Bands is:
Why Use Bollinger Bands in Cryptocurrency Trading?
The cryptocurrency market is known for its high volatility, making Bollinger Bands an ideal tool for identifying potential breakouts, reversals, and trends. By observing how price interacts with the bands, traders can gain insights into market sentiment and make informed decisions about when to enter or exit trades.
Bollinger Bands Trading Strategies
1. Bollinger Band Squeeze
The Bollinger Band Squeeze is one of the most popular strategies among traders. This strategy occurs when the bands contract, indicating low volatility and potential consolidation. A breakout often follows a squeeze, which can signal the start of a new trend.
Bullish Breakout: When the price breaks above the upper band after a squeeze, it can indicate a potential upward trend. Traders may see this as a buy signal.
Bearish Breakout: When the price breaks below the lower band after a squeeze, it can indicate a potential downward trend. Traders may see this as a sell signal.
Practical Example: Suppose you're trading Ethereum, and the Bollinger Bands contract tightly around the price, indicating low volatility. A trader might anticipate a breakout and prepare to enter a trade based on the direction of the move once the bands expand.
2. Bollinger Bands Reversal
Another effective strategy is to use Bollinger Bands to identify potential reversals. When the price touches or moves beyond the upper or lower bands, it may indicate that the asset is overbought or oversold, signaling a possible reversal.
Overbought Condition: When the price touches or moves above the upper band, it may indicate that the asset is overbought, and a price correction could be imminent. Traders may consider selling or shorting the asset.
Oversold Condition: When the price touches or moves below the lower band, it may indicate that the asset is oversold, and a price rebound could be likely. Traders may consider buying the asset.
3. Bollinger Bands and RSI Combination
Combining Bollinger Bands with the Relative Strength Index (RSI) can enhance the effectiveness of trading strategies. The RSI helps confirm whether the asset is truly overbought or oversold, adding another layer of confirmation to Bollinger Bands signals.
Confirming Reversals: If the price touches the upper band and the RSI is in overbought territory (above 70), it could strengthen the signal for a potential price reversal. Conversely, if the price touches the lower band and the RSI is in oversold territory (below 30), it could confirm a potential rebound.
How to Read Bollinger Bands
To correctly interpret Bollinger Bands, traders focus on the following:
- Band Width: The width between the upper and lower bands indicates volatility. Wider bands suggest higher volatility, while narrower bands indicate lower volatility.
- Price Interaction with Bands: The price's position relative to the bands can indicate whether the market is overbought, oversold, or in a consolidation phase.
Comparing Bollinger Bands with Other Volatility Indicators
While Bollinger Bands are a popular tool for measuring volatility, other indicators like the Average True Range (ATR) and Standard Deviation also provide insights into market volatility. Bollinger Bands are unique in that they visually represent potential support and resistance levels, making them particularly useful for identifying breakouts and reversals.
Frequently Asked Questions About Bollinger Bands
What is a good Bollinger Band setup for trading? A typical Bollinger Band setup uses a 20-period SMA with bands set two standard deviations away from the middle band. However, traders may adjust these settings based on their strategy and market conditions.
Can Bollinger Bands be used in all markets? Yes, Bollinger Bands are versatile and can be used in various markets, including cryptocurrencies, forex, and stocks. Their effectiveness may vary depending on market conditions and the specific strategy being used.
Are Bollinger Bands better than ATR or Standard Deviation? Bollinger Bands serve a different purpose than ATR or Standard Deviation. While ATR measures the average range of price movement and Standard Deviation quantifies dispersion around the mean, Bollinger Bands visually represent potential support and resistance levels based on volatility. The choice between them depends on the trader's strategy and market conditions.
Bollinger Bands Applications in Forex and Stock Trading
While this article focuses primarily on cryptocurrencies, Bollinger Bands are also widely used in forex and stock trading. In forex, Bollinger Bands help traders identify potential breakouts and reversals in currency pairs. In the stock market, Bollinger Bands can be used to assess the volatility and momentum of individual stocks or indices, aiding traders in making informed decisions.
Conclusion: Bollinger Bands as a Versatile Volatility Indicator
Bollinger Bands are a powerful tool for any trader, whether operating in cryptocurrencies, forex, or stocks. Their ability to measure market volatility, identify potential breakouts, and signal reversals makes them an essential component of a trader's toolkit.