
What is the CCI?
The Commodity Channel Index (CCI) is a versatile momentum-based technical indicator that can be used to identify cyclical trends not only in commodities but also in cryptocurrencies, forex, and stocks. Developed by Donald Lambert in 1980, the CCI measures the deviation of the current price from its historical average price. Although it was initially designed for commodities, its utility has been proven across various financial markets.
How Does the CCI Work?
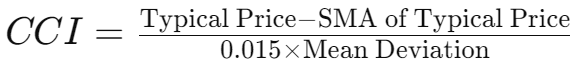
The CCI is calculated by taking the difference between the typical price (average of high, low, and close) and the simple moving average (SMA) of the typical price, then dividing this difference by the mean absolute deviation of the typical price. The result is multiplied by a constant (usually 0.015) to ensure that approximately 70-80% of the CCI values fall within the range of -100 to +100.
The formula for the CCI is:
Why Use the CCI in Cryptocurrency Trading?
The cryptocurrency market is known for its high volatility and rapid price movements, making the CCI a valuable tool for identifying overbought or oversold conditions, as well as for spotting potential trend reversals. The CCI's ability to measure the deviation of price from its historical average makes it particularly useful in markets that experience sharp price fluctuations.
CCI Trading Strategies
1. Overbought and Oversold Strategy
One of the most straightforward ways to use the CCI is to identify overbought and oversold conditions. A CCI value above +100 suggests that the asset is overbought, and a price correction may be imminent. Conversely, a CCI value below -100 suggests that the asset is oversold, and a price rebound could be likely.
Practical Example: Suppose you're trading Bitcoin, and the CCI rises above +100. A trader might interpret this as a signal to sell, expecting a price correction. If the CCI falls below -100, the trader might see this as an opportunity to buy, expecting the price to rebound.
2. CCI Divergence Strategy
Another effective strategy is to look for divergences between the CCI and the price of the asset. A divergence occurs when the price makes a new high or low, but the CCI does not confirm the move.
Bullish Divergence: This occurs when the price makes a new low, but the CCI forms a higher low. This can be a signal that the price might reverse to the upside.
Bearish Divergence: This occurs when the price makes a new high, but the CCI forms a lower high. This can be a signal that the price might reverse to the downside.
How to Read the CCI
To correctly read the CCI, traders often focus on the following key levels:
- +100 and above: Indicates that the asset may be overbought, and a price correction could be imminent.
- 0: This level represents the mean deviation and is often considered a neutral zone.
- -100 and below: Indicates that the asset may be oversold, and a price rebound could be likely.
In addition to these levels, traders can also look for divergences between the CCI and the price to identify potential reversal points.
Comparing CCI with RSI and MFI
While the CCI, RSI, and MFI are all momentum oscillators, the key difference lies in their calculation and interpretation. The CCI measures the deviation of the price from its historical average, while the RSI measures the speed and change of price movements, and the MFI incorporates volume along with price data. The CCI can be more sensitive to price changes and may generate more frequent signals compared to the RSI and MFI, making it particularly useful for traders looking for shorter-term trading opportunities.
Frequently Asked Questions About the CCI
What is a good CCI value to buy? A CCI value below -100 is generally considered a signal that the asset is oversold and could be a good buying opportunity.
Can the CCI be used in all markets? Yes, the CCI is versatile and can be used in various markets, including cryptocurrencies, forex, and stocks. Its effectiveness may vary depending on the specific market and the strategy being used.
Is the CCI more effective than the RSI or MFI? The effectiveness of the CCI compared to the RSI or MFI depends on the market conditions and the trader's strategy. The CCI may provide more frequent signals due to its sensitivity, while the RSI and MFI may offer more stable signals by smoothing out price and volume data.
CCI Applications in Forex and Stock Trading
While this article focuses primarily on cryptocurrencies, the CCI is also widely used in forex and stock trading. In forex, the CCI helps traders identify potential reversals in currency pairs by analyzing the price's deviation from its historical average. In the stock market, the CCI can be used to assess the strength of a stock or an index, helping traders make informed decisions based on momentum and trend deviations.
Conclusion: The CCI as a Versatile Momentum Indicator
The CCI is a powerful and versatile tool for any trader, whether operating in cryptocurrencies, forex, or stocks. Its ability to identify overbought and oversold conditions, as well as spot potential trend reversals, makes it an essential indicator in a trader's toolkit.