
What is Chaikin Money Flow (CMF)?
The Chaikin Money Flow (CMF) is a technical indicator developed by Marc Chaikin that measures the accumulation and distribution of an asset over a specified period, typically 20 days. It is based on the concept that price movements accompanied by high volume are more significant than those with low volume. The CMF oscillates between -1 and +1, providing insights into buying and selling pressure, and helping traders identify potential trends and reversals.
How Does Chaikin Money Flow Work?
The Chaikin Money Flow is calculated using the following steps:
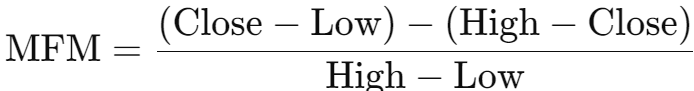
- Calculate the Money Flow Multiplier (MFM):
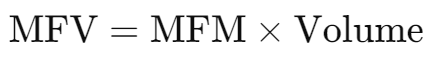
- Calculate the Money Flow Volume (MFV):
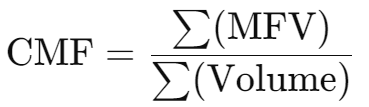
- Calculate the Chaikin Money Flow (CMF):
Why Use Chaikin Money Flow in Cryptocurrency Trading?
The cryptocurrency market is known for its high volatility and significant price fluctuations, making volume an essential factor in confirming trends and reversals. The CMF indicator helps traders assess the strength of buying and selling pressure by combining price movement with volume. This makes it particularly useful for identifying whether a trend is likely to continue or if a reversal is imminent.
Chaikin Money Flow Trading Strategies
1. Trend Confirmation
One of the primary uses of the CMF is to confirm the strength and direction of a trend.
Bullish Trend: When the CMF is above zero, it indicates that buying pressure is dominant, and the trend is likely to continue upward. Traders may consider entering or holding long positions.
Bearish Trend: When the CMF is below zero, it indicates that selling pressure is dominant, and the trend is likely to continue downward. Traders may consider entering or holding short positions.
Practical Example: Suppose you're trading Bitcoin, and the CMF is consistently above zero while the price is in an uptrend. A trader might interpret this as a signal that the uptrend is strong and likely to continue.
2. Identifying Divergences
Divergences between the CMF and the price can be a powerful tool for spotting potential reversals.
Bullish Divergence: Occurs when the price makes a new low, but the CMF makes a higher low. This indicates that despite the price drop, buying pressure is increasing, which could lead to a reversal to the upside.
Bearish Divergence: Occurs when the price makes a new high, but the CMF makes a lower high. This suggests that despite the price increase, selling pressure is growing, which could lead to a reversal to the downside.
3. Combining CMF with Other Indicators
The CMF is often used in conjunction with other technical indicators, such as moving averages or the Relative Strength Index (RSI), to enhance trading decisions.
Confirming Signals: For example, if the CMF is above zero and the RSI indicates that the asset is not overbought, this could strengthen the case for entering a long position.
How to Read Chaikin Money Flow
To correctly interpret the CMF, traders focus on the following key points:
- Above Zero: Indicates positive money flow, with more buying pressure. This is typically a bullish signal.
- Below Zero: Indicates negative money flow, with more selling pressure. This is typically a bearish signal.
- Divergences: Divergences between the CMF and price action can signal potential reversals, offering valuable entry and exit points.
Comparing CMF with Other Volume Indicators
While the CMF focuses on the relationship between price and volume over a specified period, other volume indicators like the On-Balance Volume (OBV) and the Accumulation/Distribution Line also provide insights into buying and selling pressure. The CMF is unique in that it directly relates the closing price to the high-low range and volume, offering a more nuanced view of accumulation and distribution dynamics.
Frequently Asked Questions About Chaikin Money Flow
What is a good CMF value to trade? A CMF value above zero is generally considered bullish, while a value below zero is bearish. Traders often look for a sustained CMF above or below zero to confirm the strength of a trend.
Can the CMF be used in all markets? Yes, the CMF is versatile and can be used in various markets, including cryptocurrencies, forex, and stocks. Its effectiveness may vary depending on market conditions and the specific strategy being used.
Is the CMF better than OBV or the Accumulation/Distribution Line? The CMF, OBV, and Accumulation/Distribution Line each have their strengths. The CMF offers a more dynamic view by considering the closing price relative to the high-low range, while OBV and the Accumulation/Distribution Line focus more directly on volume. The choice depends on the trader's strategy and market conditions.
Chaikin Money Flow Applications in Forex and Stock Trading
While this article focuses primarily on cryptocurrencies, the CMF is also widely used in forex and stock trading. In forex, the CMF helps traders assess whether buying or selling pressure is dominant in currency pairs, providing insights into potential trend continuations or reversals. In the stock market, the CMF can be used to evaluate the strength of trends in individual stocks or indices, helping traders make informed decisions about entry and exit points.
Conclusion: Chaikin Money Flow as a Volume-Based Trend Indicator
The Chaikin Money Flow is a powerful tool for any trader, whether operating in cryptocurrencies, forex, or stocks. Its ability to combine price and volume data into a single indicator makes it an essential part of any trend-following or reversal strategy.