
What is the Chande Momentum Oscillator (CMO)?
The Chande Momentum Oscillator (CMO) is a technical indicator developed by Tushar Chande in 1994. It is a momentum-based oscillator that measures the rate of change in price movements, helping traders identify overbought and oversold conditions, as well as potential reversals. The CMO oscillates between -100 and +100, with values above 50 indicating overbought conditions and values below -50 indicating oversold conditions. Unlike other oscillators, the CMO takes into account both the up and down days, making it a more sensitive indicator of momentum changes.
How Does the Chande Momentum Oscillator Work?
The Chande Momentum Oscillator is calculated using the following steps:
- Calculate the Up Days and Down Days:
- Up Days: Sum of all positive price changes over the selected period.
- Down Days: Sum of all negative price changes (in absolute value) over the selected period.
- Calculate the CMO using the following formula:
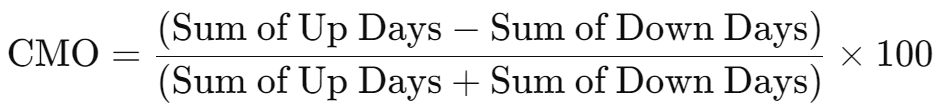
The result is an oscillator that fluctuates between -100 and +100, providing insights into the momentum of the asset's price movements.
Why Use Chande Momentum Oscillator in Cryptocurrency Trading?
The cryptocurrency market is known for its rapid price movements and high volatility, making the CMO an effective tool for detecting changes in momentum. By identifying overbought and oversold conditions, the CMO helps traders make more informed decisions about when to enter or exit trades, particularly in fast-moving markets like cryptocurrencies.
Chande Momentum Oscillator Trading Strategies
1. Identifying Overbought and Oversold Conditions
One of the primary uses of the CMO is to identify overbought and oversold conditions.
Overbought Conditions: When the CMO rises above +50, it indicates that the asset may be overbought, and a price correction could be imminent. Traders may consider selling or shorting the asset.
Oversold Conditions: When the CMO falls below -50, it indicates that the asset may be oversold, and a price rebound could be likely. Traders may consider buying the asset.
Practical Example: Suppose you're trading Bitcoin, and the CMO rises above +50. A trader might interpret this as a signal to sell, expecting a price correction. Conversely, if the CMO falls below -50, the trader might see this as a buying opportunity, anticipating a rebound.
2. Divergence Strategy
Divergences between the CMO and the price of the asset can be powerful indicators of potential trend reversals.
Bullish Divergence: Occurs when the price makes a new low, but the CMO forms a higher low. This suggests that despite the price decline, the downward momentum is weakening, which could lead to a reversal to the upside.
Bearish Divergence: Occurs when the price makes a new high, but the CMO forms a lower high. This indicates that despite the price increase, the upward momentum is weakening, which could lead to a reversal to the downside.
3. Combining CMO with Other Indicators
The CMO can be combined with other technical indicators, such as moving averages or the Relative Strength Index (RSI), to enhance trading decisions.
Confirming Signals: For example, if the CMO indicates an oversold condition and the RSI also shows that the asset is oversold, this could strengthen the case for entering a long position.
How to Read Chande Momentum Oscillator
To correctly interpret the CMO, traders focus on the following key points:
- Above +50: Indicates overbought conditions, where the price may soon reverse downward.
- Below -50: Indicates oversold conditions, where the price may soon reverse upward.
- Divergences: Divergences between the CMO and price action can signal potential reversals, offering valuable entry and exit points.
Comparing CMO with Other Momentum Indicators
While the CMO measures momentum by considering both up and down days, other momentum indicators like the Relative Strength Index (RSI) and the Stochastic Oscillator also provide insights into market momentum. The CMO is unique in its sensitivity to price changes, making it particularly useful for traders looking for a more responsive indicator.
Frequently Asked Questions About Chande Momentum Oscillator
What is a good CMO value to trade? A CMO value above +50 is generally considered overbought, while a value below -50 is considered oversold. Traders often look for a sustained CMO above or below these levels to confirm overbought or oversold conditions.
Can CMO be used in all markets? Yes, the CMO is versatile and can be used in various markets, including cryptocurrencies, forex, and stocks. Its effectiveness may vary depending on market conditions and the specific strategy being used.
Is CMO better than RSI or the Stochastic Oscillator? The CMO, RSI, and Stochastic Oscillator each offer different insights. The CMO is particularly sensitive to price changes, making it better suited for volatile markets, while RSI and the Stochastic Oscillator provide more stable signals. The choice depends on the trader's strategy and market conditions.
Chande Momentum Oscillator Applications in Forex and Stock Trading
While this article focuses primarily on cryptocurrencies, the CMO is also widely used in forex and stock trading. In forex, the CMO helps traders assess the momentum of currency pairs, providing insights into potential trend continuations or reversals. In the stock market, the CMO can be used to evaluate the momentum of individual stocks or indices, aiding traders in making informed decisions about entry and exit points.
Conclusion: Chande Momentum Oscillator as a Dynamic Momentum Indicator
The Chande Momentum Oscillator is a powerful tool for any trader, whether operating in cryptocurrencies, forex, or stocks. Its ability to measure the rate of change in price movements makes it an essential indicator for identifying trends, reversals, and overbought/oversold conditions.