What is the Ichimoku Cloud?
The Ichimoku Cloud, also known as Ichimoku Kinko Hyo, is a comprehensive technical analysis tool that combines multiple indicators into a single chart. Developed by Japanese journalist Goichi Hosoda in the late 1930s and published in the 1960s, the Ichimoku Cloud provides insights into trend direction, momentum, and potential support and resistance levels. It is widely used in various markets, including cryptocurrency, forex, and stocks.
How Does the Ichimoku Cloud Work?
The Ichimoku Cloud consists of five key components:
STEP 1: Tenkan-sen (Conversion Line): Calculated as the average of the highest high and the lowest low over the past 9 periods.

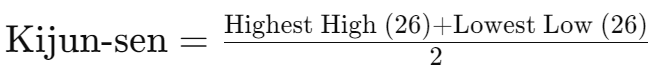
STEP 2: Kijun-sen (Base Line): Calculated as the average of the highest high and the lowest low over the past 26 periods.
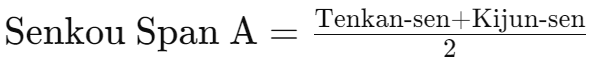
STEP 3: Senkou Span A (Leading Span A): The midpoint between the Tenkan-sen and Kijun-sen, plotted 26 periods ahead.
STEP 4: Senkou Span B (Leading Span B): The average of the highest high and the lowest low over the past 52 periods, plotted 26 periods ahead.

STEP 5: Chikou Span (Lagging Span): The closing price plotted 26 periods behind the current period.
The area between Senkou Span A and Senkou Span B forms the "cloud" (Kumo), which is a key element in the Ichimoku system. The cloud's thickness and position relative to the price provide insights into market trends and potential support and resistance levels.
Why Use the Ichimoku Cloud in Cryptocurrency Trading?
The cryptocurrency market is known for its rapid price movements and strong trends, making the Ichimoku Cloud an ideal tool for identifying the overall trend, potential reversals, and key support/resistance levels. Unlike other indicators that focus on a single aspect of the market, the Ichimoku Cloud offers a holistic view, allowing traders to make more informed decisions.
Ichimoku Cloud Trading Strategies
1. Trend Identification
One of the primary uses of the Ichimoku Cloud is to identify the direction of the trend.
Bullish Trend: When the price is above the cloud, and the cloud is green (Senkou Span A above Senkou Span B), it indicates a bullish trend.
Bearish Trend: When the price is below the cloud, and the cloud is red (Senkou Span B above Senkou Span A), it indicates a bearish trend.
Neutral Trend: When the price is within the cloud, it suggests a period of consolidation or uncertainty.
Practical Example: Suppose you're trading Bitcoin, and the price is above the cloud, with the cloud green. A trader might interpret this as a bullish signal and look for buying opportunities.
2. Support and Resistance Levels
The cloud also acts as a dynamic support and resistance level.
Support in a Bullish Trend: When the price retraces toward the cloud during an uptrend, the cloud often acts as a support level where the price might bounce back.
Resistance in a Bearish Trend: During a downtrend, the cloud can act as a resistance level, where the price may struggle to break through.
3. Crossovers and Signals
The Ichimoku Cloud also generates trading signals based on crossovers.
Bullish Crossover: When the Tenkan-sen crosses above the Kijun-sen, it generates a bullish signal, especially if it occurs above the cloud.
Bearish Crossover: When the Tenkan-sen crosses below the Kijun-sen, it generates a bearish signal, particularly if it occurs below the cloud.
How to Read the Ichimoku Cloud
To correctly interpret the Ichimoku Cloud, traders focus on the following key components:
- Price Position Relative to the Cloud: Indicates the overall trend direction (above the cloud is bullish, below the cloud is bearish).
- Cloud Color and Thickness: A green cloud suggests bullish momentum, while a red cloud indicates bearish momentum. Thicker clouds represent stronger support/resistance levels.
- Tenkan-sen and Kijun-sen Crossovers: Generate buy and sell signals depending on their position relative to the cloud.
Comparing Ichimoku Cloud with Other Indicators
The Ichimoku Cloud is unique in its ability to provide a comprehensive view of the market, combining trend identification, momentum, and support/resistance levels. Unlike moving averages or Bollinger Bands, which focus on specific aspects of price action, the Ichimoku Cloud offers a complete picture, making it particularly useful for traders looking to understand the overall market context.
Frequently Asked Questions About the Ichimoku Cloud
What is the best time frame to use with the Ichimoku Cloud? The Ichimoku Cloud is versatile and can be used on various time frames. However, it is most commonly used on daily and weekly charts for identifying long-term trends.
Can the Ichimoku Cloud be used in all markets? Yes, the Ichimoku Cloud is a versatile tool that can be used in various markets, including cryptocurrencies, forex, and stocks. Its effectiveness may vary depending on market conditions and the specific strategy being used.
Is the Ichimoku Cloud better than moving averages? The Ichimoku Cloud provides more information than simple moving averages, offering insights into trend direction, momentum, and support/resistance levels. However, it is more complex and may require more experience to interpret effectively.
Ichimoku Cloud Applications in Forex and Stock Trading
While this article focuses primarily on cryptocurrencies, the Ichimoku Cloud is also widely used in forex and stock trading. In forex, the Ichimoku Cloud helps traders identify strong trends in currency pairs and determine potential reversal points. In the stock market, it can be used to assess the momentum and trend direction of individual stocks or indices, aiding traders in making informed decisions.
Conclusion: Ichimoku Cloud as a Comprehensive Trading Tool
The Ichimoku Cloud is a powerful tool for any trader, whether operating in cryptocurrencies, forex, or stocks. Its ability to provide a holistic view of the market, including trend direction, momentum, and support/resistance levels, makes it an essential indicator for traders looking to understand the broader market context.