
What is the MFI?
The Money Flow Index (MFI) is a momentum oscillator that uses both price and volume data to measure buying and selling pressure. Sometimes referred to as the "volume-weighted RSI," the MFI is used to identify overbought or oversold conditions in an asset, as well as to detect potential reversals in trends. The MFI oscillates between 0 and 100, with levels above 80 indicating overbought conditions and levels below 20 indicating oversold conditions.
How Does the MFI Work?
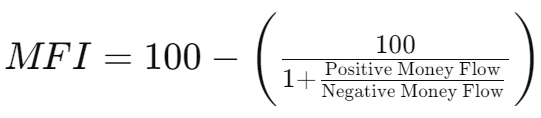
The MFI is calculated in several steps, starting with the calculation of the typical price, which is the average of the high, low, and close prices for a given period. The typical price is then multiplied by the volume to calculate the raw money flow. Finally, the MFI is derived by comparing positive and negative money flows over a specified period, typically 14 days.
The formula for the MFI is:
Why Use the MFI in Cryptocurrency Trading?
The cryptocurrency market is known for its extreme volatility, making the MFI an ideal tool for identifying potential overbought or oversold conditions based on both price and volume. Since the MFI incorporates volume, it can provide additional insight into market sentiment, helping traders make more informed decisions about entry and exit points.
MFI Trading Strategies
1. Overbought and Oversold Strategy
One of the most straightforward strategies using the MFI is to look for overbought and oversold conditions. When the MFI rises above 80, it suggests that the asset may be overbought and due for a correction. Conversely, when the MFI falls below 20, it suggests that the asset may be oversold and could be poised for a rebound.
Practical Example: Suppose you're trading Bitcoin, and the MFI rises above 80. A trader might interpret this as a signal to sell, anticipating a potential price correction. If the MFI falls below 20, the trader might see this as an opportunity to buy, expecting the price to rebound.
2. MFI Divergence Strategy
Another effective strategy is to look for divergences between the MFI and the price of the asset. A divergence occurs when the price makes a new high or low, but the MFI does not confirm the move.
Bullish Divergence: This occurs when the price makes a new low, but the MFI forms a higher low. This can be a signal that the price might reverse to the upside.
Bearish Divergence: This occurs when the price makes a new high, but the MFI forms a lower high. This can be a signal that the price might reverse to the downside.
How to Read the MFI
To correctly read the MFI, traders often focus on the following key levels:
- 80 and above: Indicates that the asset may be overbought, and a price correction could be imminent.
- 50: Considered a neutral level, where there is no dominant buying or selling pressure.
- 20 and below: Indicates that the asset may be oversold, and a price rebound could be likely.
In addition to these levels, traders may also look for divergences between the MFI and the price to identify potential reversal points.
Comparing MFI with RSI
While both the MFI and RSI are momentum oscillators, the key difference is that the MFI incorporates volume data, whereas the RSI is based solely on price. This makes the MFI particularly useful in markets where volume plays a significant role, such as cryptocurrencies or stocks with high trading volume. The inclusion of volume data can make the MFI a more reliable indicator in some cases, as it reflects the intensity of buying or selling pressure more accurately.
Frequently Asked Questions About the MFI
What is a good MFI value to buy? An MFI value below 20 is generally considered a signal that the asset is oversold and could be a good buying opportunity.
Can the MFI be used in all markets? Yes, the MFI is versatile and can be used in various markets, including cryptocurrencies, forex, and stocks. Its effectiveness may vary depending on the specific market and the strategy being used.
How is the MFI different from the RSI? The main difference is that the MFI incorporates volume data, whereas the RSI is based solely on price. This can make the MFI a more reliable indicator in markets where volume is a crucial factor.
MFI Applications in Forex and Stock Trading
While this article focuses primarily on cryptocurrencies, the MFI is also widely used in forex and stock trading. In forex, the MFI helps traders identify potential reversals in currency pairs by analyzing both price and volume. In the stock market, the MFI can be used to assess the strength of a stock or an index, helping traders make informed decisions based on volume-weighted momentum.
Conclusion: The MFI as a Comprehensive Momentum Indicator
The MFI is a powerful tool for any trader, whether operating in cryptocurrencies, forex, or stocks. Its ability to combine price and volume data provides a more comprehensive view of market conditions, making it an essential indicator for identifying overbought or oversold conditions and potential trend reversals.