
What are Pivot Points?
Pivot Points are a popular technical analysis tool used to determine potential support and resistance levels in the financial markets. Originally used by floor traders on stock exchanges, Pivot Points are calculated using the high, low, and closing prices of the previous trading session. These levels help traders identify potential reversal points, trend continuations, and market sentiment. Pivot Points are especially useful in day trading and short-term trading strategies, as they provide clear, actionable levels for entry and exit points.
How Do Pivot Points Work?
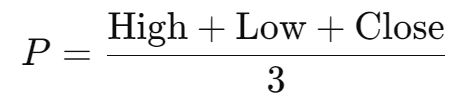
Pivot Points are calculated using the following formulas:
- Pivot Point (P):
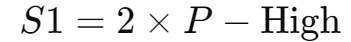
- Support Levels:
- Support 1 (S1):
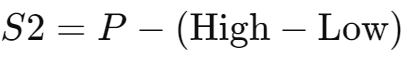
- Support 2 (S2):
- Support 3 (S3):

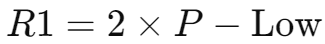
- Resistance Levels:
- Resistance 1 (R1):
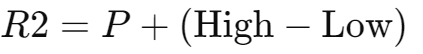
- Resistance 2 (R2):
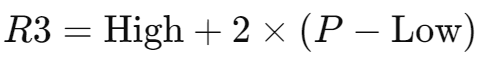
- Resistance 3 (R3):
These levels are plotted on a chart to provide traders with a visual representation of where the price may find support or resistance during the current trading session.
Why Use Pivot Points in Cryptocurrency Trading?
The cryptocurrency market is known for its rapid price movements and high volatility, making Pivot Points an essential tool for identifying key price levels where the market may reverse or continue its trend. By providing clear support and resistance levels, Pivot Points help traders make more informed decisions about entry and exit points, particularly in fast-moving markets like cryptocurrencies.
Pivot Points Trading Strategies
1. Support and Resistance Trading
The most common use of Pivot Points is to trade based on the support and resistance levels they generate.
Support Levels: When the price approaches a Pivot Point support level (S1, S2, S3), traders may look for buying opportunities, anticipating that the price will bounce off the support level and move higher.
Resistance Levels: When the price approaches a Pivot Point resistance level (R1, R2, R3), traders may look for selling opportunities, anticipating that the price will reverse and move lower.
Practical Example: Suppose you're trading Bitcoin, and the price approaches the S1 support level. A trader might consider entering a long position, expecting the price to bounce off the support level and rise.
2. Pivot Point Breakout Strategy
Another effective strategy is to trade breakouts above or below the Pivot Point levels.
Bullish Breakout: If the price breaks above the Pivot Point (P) and holds above it, this could indicate a bullish trend continuation. Traders may consider entering a long position.
Bearish Breakout: If the price breaks below the Pivot Point (P) and holds below it, this could indicate a bearish trend continuation. Traders may consider entering a short position.
3. Pivot Point Reversal Strategy
Pivot Points can also be used to identify potential reversals in the market.
Bullish Reversal: If the price falls below a support level (e.g., S1) but then quickly reverses and moves back above it, this could signal a bullish reversal. Traders may consider entering a long position.
Bearish Reversal: If the price rises above a resistance level (e.g., R1) but then quickly reverses and moves back below it, this could signal a bearish reversal. Traders may consider entering a short position.
How to Read Pivot Points
To correctly interpret Pivot Points, traders focus on the following key levels:
- Pivot Point (P): The central level that acts as a potential turning point for the market.
- Support Levels (S1, S2, S3): Levels where the price may find support and bounce higher.
- Resistance Levels (R1, R2, R3): Levels where the price may encounter resistance and reverse lower.
Comparing Pivot Points with Other Support and Resistance Indicators
While Pivot Points provide a straightforward method for identifying support and resistance levels, other tools like Fibonacci retracement levels and moving averages also offer insights into potential reversal points. Pivot Points are unique in their simplicity and their ability to provide multiple levels of support and resistance based on previous price action. This makes them particularly useful for day traders and those looking for clear, actionable levels in fast-moving markets.
Frequently Asked Questions About Pivot Points
What is a good period for calculating Pivot Points? Pivot Points are typically calculated using the previous day's high, low, and close for day trading. For longer-term trading, you can use weekly or monthly data.
Can Pivot Points be used in all markets? Yes, Pivot Points are versatile and can be used in various markets, including cryptocurrencies, forex, and stocks. Their effectiveness may vary depending on market conditions and the specific strategy being used.
Are Pivot Points better than Fibonacci retracement levels? Pivot Points and Fibonacci retracement levels serve similar purposes in identifying support and resistance levels. Pivot Points are calculated using a straightforward formula, while Fibonacci retracement levels are based on key Fibonacci ratios. The choice between them depends on the trader's strategy and preference.
Pivot Points Applications in Forex and Stock Trading
While this article focuses primarily on cryptocurrencies, Pivot Points are also widely used in forex and stock trading. In forex, Pivot Points help traders identify key levels where currency pairs may reverse or continue their trends. In the stock market, Pivot Points can be used to evaluate potential reversal points in individual stocks or indices, aiding traders in making informed decisions about entry and exit points.
Conclusion: Pivot Points as a Practical Tool for Day Trading
Pivot Points are a powerful tool for any trader, whether operating in cryptocurrencies, forex, or stocks. Their ability to provide clear, actionable support and resistance levels makes them an essential indicator for day traders and those looking to capitalize on short-term price movements.