
What is Rate of Change (ROC)?
The Rate of Change (ROC) is a momentum oscillator that measures the percentage change in price between the current price and the price a certain number of periods ago. The ROC is a versatile indicator used to identify the speed and direction of price movements, helping traders to spot potential reversals, overbought and oversold conditions, and confirm trends. The ROC oscillates above and below a zero line, with positive values indicating upward momentum and negative values indicating downward momentum.
How Does Rate of Change Work?
The Rate of Change is calculated using the following formula:
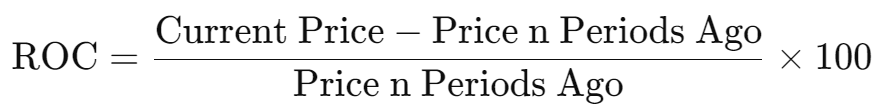
Where:
- Current Price is the most recent closing price.
- Price n Periods Ago is the closing price n periods ago (where n is the selected period, typically 14 or 21).
The ROC generates values that fluctuate above and below zero, with higher positive values indicating stronger upward momentum and lower negative values indicating stronger downward momentum.
Why Use Rate of Change in Cryptocurrency Trading?
The cryptocurrency market is characterized by rapid price movements and high volatility, making the ROC an effective tool for detecting changes in momentum. The ROC helps traders assess whether the current trend is likely to continue or if a reversal is imminent. It is also useful for identifying overbought and oversold conditions, allowing traders to time their entries and exits more effectively.
Rate of Change Trading Strategies
1. Identifying Overbought and Oversold Conditions
One of the primary uses of the ROC is to identify overbought and oversold conditions in the market.
Overbought Conditions: When the ROC reaches an extreme positive value, it indicates that the asset may be overbought, and a price correction could be imminent. Traders may consider selling or shorting the asset.
Oversold Conditions: When the ROC reaches an extreme negative value, it indicates that the asset may be oversold, and a price rebound could be likely. Traders may consider buying the asset.
Practical Example: Suppose you're trading Bitcoin, and the ROC reaches an extreme positive value. A trader might interpret this as a signal to sell, expecting a price correction. Conversely, if the ROC reaches an extreme negative value, the trader might see this as a buying opportunity, anticipating a rebound.
2. Divergence Strategy
Divergences between the ROC and the price of the asset can be powerful indicators of potential trend reversals.
Bullish Divergence: Occurs when the price makes a new low, but the ROC forms a higher low. This suggests that despite the price decline, the downward momentum is weakening, which could lead to a reversal to the upside.
Bearish Divergence: Occurs when the price makes a new high, but the ROC forms a lower high. This indicates that despite the price increase, the upward momentum is weakening, which could lead to a reversal to the downside.
3. Trend Confirmation
The ROC can also be used to confirm the strength of a trend.
Bullish Trend Confirmation: When the ROC is above zero and rising, it confirms that upward momentum is strong, supporting the continuation of the uptrend. Traders may consider entering or holding long positions.
Bearish Trend Confirmation: When the ROC is below zero and falling, it confirms that downward momentum is strong, supporting the continuation of the downtrend. Traders may consider entering or holding short positions.
How to Read Rate of Change
To correctly interpret the ROC, traders focus on the following key points:
- Above Zero: Indicates positive momentum, with buying pressure driving prices higher. This is typically a bullish signal.
- Below Zero: Indicates negative momentum, with selling pressure driving prices lower. This is typically a bearish signal.
- Extreme Values: Extremely high or low ROC values can indicate overbought or oversold conditions, signaling potential reversals.
Comparing Rate of Change with Other Momentum Indicators
While the ROC measures the percentage change in price over a specified period, other momentum indicators like the Relative Strength Index (RSI) and the Moving Average Convergence Divergence (MACD) also provide insights into market momentum. The ROC is unique in its simplicity and direct approach to measuring price momentum, making it particularly useful for traders looking for quick and clear signals of market strength.
Frequently Asked Questions About Rate of Change
What is a good ROC value to trade? There is no specific ROC value that is universally considered "good" for trading. Traders focus on the direction and magnitude of the ROC line and its relationship with price movements to make decisions.
Can ROC be used in all markets? Yes, ROC is versatile and can be used in various markets, including cryptocurrencies, forex, and stocks. Its effectiveness may vary depending on market conditions and the specific strategy being used.
Is ROC better than RSI or MACD? ROC, RSI, and MACD each offer different insights. ROC provides a straightforward measure of price momentum, while RSI focuses on overbought and oversold conditions, and MACD analyzes the relationship between moving averages. The choice depends on the trader's strategy and market conditions.
Rate of Change Applications in Forex and Stock Trading
While this article focuses primarily on cryptocurrencies, ROC is also widely used in forex and stock trading. In forex, ROC helps traders assess the momentum of currency pairs, providing insights into potential trend continuations or reversals. In the stock market, ROC can be used to evaluate the momentum of individual stocks or indices, aiding traders in making informed decisions about entry and exit points.
Conclusion: Rate of Change as a Dynamic Momentum Indicator
The Rate of Change is a powerful tool for any trader, whether operating in cryptocurrencies, forex, or stocks. Its ability to measure the speed and direction of price movements makes it an essential indicator for identifying trends, reversals, and overbought/oversold conditions.