
What is the RSI?
The Relative Strength Index (RSI) is a widely-used technical indicator in the financial markets, including cryptocurrency, forex, and stock trading. Developed by J. Welles Wilder in 1978, the RSI measures the speed and change of price movements. The RSI is represented as an oscillator (a line that moves between two extremes) and has a value that ranges from 0 to 100.
How Does the RSI Work?
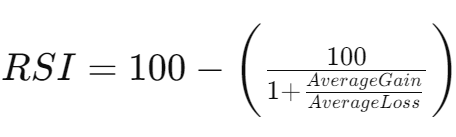
The RSI is calculated using the following RSI indicator formula:
The indicator is generally used to identify overbought or oversold conditions in an asset. An RSI value above 70 is considered overbought, while a value below 30 is considered oversold. This can indicate that the asset is poised for a correction or reversal in price direction.
Why Use the RSI in Cryptocurrency Trading?
The cryptocurrency market is known for its extreme volatility, making it an ideal environment for the use of technical indicators like the RSI. Cryptocurrency traders use the RSI to identify potential entry and exit points based on overbought and oversold levels.
RSI Trading Strategies
1. Basic Overbought and Oversold Strategy
This is the simplest and most commonly used strategy with the RSI. When the RSI is above 70, it may indicate that the asset is overbought, suggesting a potential correction downward. Conversely, an RSI below 30 may indicate that the asset is oversold and could be ready for a rebound.
Practical Example of RSI Bull & Sell signal: Suppose Bitcoin's RSI rises above 70. A trader might interpret this as a signal to sell, anticipating a correction. If the RSI drops below 30, the trader might see this as an opportunity to buy, expecting the price to rise.
2. RSI Divergence Strategy
Another popular strategy is to look for divergences between the RSI and the asset's price. A divergence occurs when the asset's price reaches a new high or low, but the RSI does not follow that trend.
Bullish Divergence: This occurs when the price makes a new low, but the RSI forms a higher low. This can be a signal that the price might reverse to the upside.
Bearish Divergence: This occurs when the price makes a new high, but the RSI forms a lower high. This can be a signal that the price might reverse to the downside.
How to Read the RSI
To correctly read the RSI, traders often focus on the following key levels:
- 70 and above: Indicates that the asset may be overbought.
- 50: Considered a neutral level, where there is no dominant buying or selling pressure.
- 30 and below: Indicates that the asset may be oversold.
In addition to these levels, traders can adjust the thresholds to suit their particular strategies or the specific volatility of the asset they are analyzing.
Comparing RSI with Other Technical Indicators
The RSI is just one of many tools in a trader's arsenal. Compared to other indicators like the MACD or Bollinger Bands, the RSI provides a straightforward view of an asset's strength relative to its recent movements. Unlike other indicators that can be more complex, the RSI is easy to interpret, making it ideal for both novice and experienced traders.
Frequently Asked Questions About the RSI
What is a good RSI value to buy? An RSI value below 30 is generally considered a signal that the asset is oversold and could be a good buying opportunity.
Does the RSI work well in all markets? The RSI is versatile and can be used in various markets, including cryptocurrencies, forex, and stocks. However, its effectiveness may vary depending on market volatility and the specific strategy you use.
How is the RSI calculated? The RSI is calculated using the formula mentioned above, where the average gain and average loss over a specific period are compared.
RSI Applications in Forex and Stock Trading
Although this article focuses primarily on cryptocurrencies, it is important to mention that the RSI is also widely used in forex and stock trading. In forex, the RSI helps traders identify potential reversal points in currency pairs. In the stock market, the RSI can be used to assess the strength of a specific stock or an entire index.
Conclusion: The RSI as an Essential Tool for the Modern Trader
The RSI is a powerful tool for any trader, whether operating in cryptocurrencies, forex, or stocks. Its simplicity and effectiveness make it an indispensable indicator for identifying overbought and oversold conditions, as well as for detecting potential market reversals.