
What is the SMA?
The Simple Moving Average (SMA) is one of the most commonly used technical indicators in trading. Unlike the Exponential Moving Average (EMA), which gives more weight to recent prices, the SMA assigns equal weight to all prices within the selected time period. This makes it a straightforward tool for identifying the overall direction of a trend and smoothing out price fluctuations.
How Does the SMA Work?
The SMA is calculated by taking the average of a selected number of closing prices. For example, a 10-day SMA adds up the closing prices of the last 10 days and then divides by 10 to get the average. The formula for the SMA is:
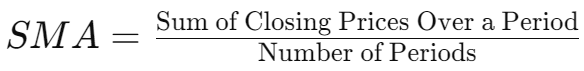
This results in a line on the price chart that helps traders identify the general direction of the market.
Why Use the SMA in Cryptocurrency Trading?
The cryptocurrency market is known for its high volatility, making the SMA a valuable tool for smoothing out price action and identifying trends. The simplicity of the SMA allows traders to easily spot bullish or bearish trends and make informed decisions based on these trends.
SMA Trading Strategies
1. SMA Crossover Strategy
The SMA crossover strategy is one of the simplest and most effective ways to use this indicator. It involves using two SMAs of different lengths—a shorter SMA (e.g., 10-day) and a longer SMA (e.g., 50-day).
Bullish Crossover: Occurs when the shorter SMA crosses above the longer SMA, indicating a potential upward trend. Traders may see this as a buy signal.
Bearish Crossover: Occurs when the shorter SMA crosses below the longer SMA, indicating a potential downward trend. Traders may see this as a sell signal.
Practical Example: Imagine you're trading Bitcoin, and the 10-day SMA crosses above the 50-day SMA. A trader might interpret this as a signal to buy, anticipating that the price will continue to rise.
2. SMA as Support and Resistance
Another common strategy is using the SMA as a dynamic support or resistance level. In an uptrend, the SMA often acts as a support level where the price tends to bounce. In a downtrend, the SMA can act as resistance where the price struggles to break above.
Bullish Scenario: If the price pulls back to the SMA and then resumes the upward trend, it can be seen as a buying opportunity.
Bearish Scenario: If the price rallies up to the SMA and then resumes the downward trend, it can be seen as a selling opportunity.
How to Read the SMA
The SMA can be used over various time periods, depending on the trader's strategy. Commonly used SMAs include the 10-day, 50-day, and 200-day SMAs, each providing insights into short-term, medium-term, and long-term trends, respectively.
- Short-Term SMA (e.g., 10-day): More sensitive to recent price movements, useful for identifying short-term trends.
- Medium-Term SMA (e.g., 50-day): Provides a broader view of the trend, often used to confirm signals.
- Long-Term SMA (e.g., 200-day): Used to identify the overall market trend and to spot potential reversals.
Comparing SMA with Other Technical Indicators
While the SMA is similar to the EMA in its purpose, the key difference is that the SMA gives equal weight to all data points, making it less responsive to recent price changes. Compared to indicators like the RSI or MACD, the SMA provides a simple and effective way to identify the general trend of an asset without the complexity of more advanced indicators.
Frequently Asked Questions About the SMA
What is the best SMA length to use? The best SMA length depends on your trading strategy. Shorter SMAs (e.g., 10-day) are better for short-term trades, while longer SMAs (e.g., 50-day or 200-day) are better for identifying long-term trends.
Can the SMA be used in all markets? Yes, the SMA is versatile and can be used in various markets, including cryptocurrencies, forex, and stocks. Its effectiveness, however, may vary depending on market conditions and the specific strategy you use.
How is the SMA calculated? The SMA is calculated by taking the average of the closing prices over a selected number of periods, resulting in a line that helps smooth out price action and identify trends.
SMA Applications in Forex and Stock Trading
Although this article focuses primarily on cryptocurrencies, the SMA is also widely used in forex and stock trading. In forex, the SMA helps traders identify the strength of a currency pair and potential entry or exit points. In the stock market, the SMA can be used to assess the momentum of a stock or an index, helping traders make informed decisions.
Conclusion: The SMA as a Fundamental Tool for Trend Identification
The SMA is a fundamental tool for any trader, whether operating in cryptocurrencies, forex, or stocks. Its simplicity and effectiveness make it a go-to indicator for identifying trends and potential trading opportunities.