
What is Standard Deviation?
Standard Deviation is a statistical measure that represents the amount of variability or dispersion around an average. In the context of financial markets, it is used as a technical indicator to gauge market volatility. A high standard deviation indicates that prices are spread out over a large range, while a low standard deviation indicates that prices are clustered closely around the mean.
How Does Standard Deviation Work?
Standard Deviation is calculated by first determining the average (mean) price of an asset over a specified period. The differences between each closing price and the mean are then squared, averaged, and the square root of this average is taken to arrive at the Standard Deviation.
The formula for Standard Deviation is:
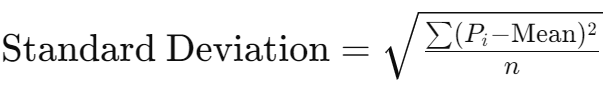
Where:
- Pi is the price at each period,
- Mean is the average price over the specified period,
- n is the number of periods.
Why Use Standard Deviation in Cryptocurrency Trading?
The cryptocurrency market is known for its high volatility, making Standard Deviation an essential tool for traders. By measuring the degree of price dispersion, Standard Deviation helps traders assess market risk, identify potential breakout opportunities, and set appropriate stop-loss levels. In periods of low Standard Deviation, prices tend to consolidate, while high Standard Deviation often precedes large price movements.
Standard Deviation Trading Strategies
1. Bollinger Bands Strategy
One of the most common applications of Standard Deviation in trading is through Bollinger Bands, a volatility indicator that uses Standard Deviation to create upper and lower bands around a moving average. These bands expand during periods of high volatility and contract during periods of low volatility.
Bollinger Band Squeeze: A trading strategy that involves looking for periods of low Standard Deviation when the bands contract. A breakout, either up or down, is often expected following such a squeeze, offering potential trading opportunities.
Practical Example: Suppose you're trading Bitcoin, and the Bollinger Bands are contracting due to low volatility (low Standard Deviation). A trader might anticipate a significant price movement and prepare for a breakout in either direction.
2. Volatility-Based Stop-Loss Strategy
Standard Deviation can also be used to set stop-loss levels based on the expected volatility of the asset. A higher Standard Deviation suggests a wider stop-loss to accommodate larger price swings, while a lower Standard Deviation suggests a tighter stop-loss.
Setting a Volatility-Based Stop-Loss: If the Standard Deviation of Ethereum over a 14-day period is high, a trader might set a stop-loss further from the entry point to avoid being stopped out by normal market fluctuations.
How to Read Standard Deviation
To correctly interpret Standard Deviation as a technical indicator, traders often look at the following:
- High Standard Deviation: Indicates increased volatility, which could signal potential trend changes, breakouts, or increased risk.
- Low Standard Deviation: Indicates low volatility, which could suggest price consolidation and a potential lack of trading opportunities in the short term.
Traders can adjust the period used to calculate Standard Deviation to suit their trading strategy. A shorter period will make the indicator more sensitive to recent price changes, while a longer period will smooth out the fluctuations.
Comparing Standard Deviation with Other Volatility Indicators
While Standard Deviation measures the volatility of price movement, other indicators like the Average True Range (ATR) and Bollinger Bands also provide insights into market volatility. Standard Deviation is unique in its ability to quantify the dispersion of price around a mean, making it particularly useful for setting volatility-based trading strategies.
Frequently Asked Questions About Standard Deviation
What is a good Standard Deviation value to trade? Standard Deviation itself doesn't generate buy or sell signals, but higher values indicate higher volatility, which can signal potential breakouts, while lower values suggest consolidation.
Can Standard Deviation be used in all markets? Yes, Standard Deviation is a versatile indicator that can be used in various markets, including cryptocurrencies, forex, and stocks. Its effectiveness may vary depending on market conditions and the specific strategy being used.
Is Standard Deviation better than ATR or Bollinger Bands? Standard Deviation serves a different purpose than ATR or Bollinger Bands. While ATR measures the average range of price movement, Standard Deviation quantifies the dispersion around a mean. Bollinger Bands, which incorporate Standard Deviation, are particularly useful for identifying potential breakout opportunities. The choice depends on the trader's goals and market conditions.
Standard Deviation Applications in Forex and Stock Trading
While this article focuses primarily on cryptocurrencies, Standard Deviation is also widely used in forex and stock trading. In forex, Standard Deviation helps traders assess the volatility of currency pairs and adjust their strategies accordingly. In the stock market, it can be used to evaluate the risk associated with individual stocks or indices, helping traders make informed decisions about entry and exit points.
Conclusion: Standard Deviation as a Key Volatility Indicator
Standard Deviation is a powerful tool for any trader, whether operating in cryptocurrencies, forex, or stocks. Its ability to measure market volatility and provide insights into potential price movements makes it a valuable addition to any trading strategy.