
What is the Vortex Indicator?
The Vortex Indicator is a technical analysis tool developed by Etienne Botes and Douglas Siepman in 2010. It is designed to identify the start of a new trend or the continuation of an existing trend in financial markets. The indicator consists of two oscillating lines, known as the positive vortex line (+VI) and the negative vortex line (-VI), which are used to determine the direction of the trend. When these lines cross, they generate buy or sell signals, making the Vortex Indicator a valuable tool for traders looking to capitalize on trending markets.
How Does the Vortex Indicator Work?
The Vortex Indicator is calculated using the following steps:
- Calculate True Range (TR):

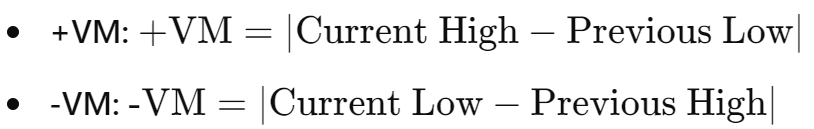
- Calculate Positive and Negative Vortex Movements:
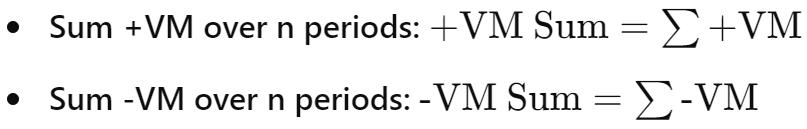
- Calculate Smoothed Vortex Movements:
- Calculate Vortex Indicator Lines:
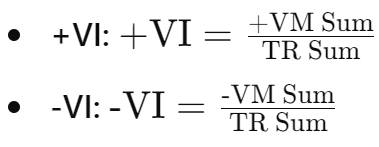
Where n is the number of periods selected by the trader, typically 14.
The resulting +VI and -VI lines oscillate above and below each other, with crossovers indicating potential buy or sell signals.
Why Use the Vortex Indicator in Cryptocurrency Trading?
The cryptocurrency market is known for its high volatility and rapid trend changes, making the Vortex Indicator an ideal tool for identifying the start or continuation of trends. By analyzing the direction and strength of price movements, the Vortex Indicator helps traders make more informed decisions about when to enter or exit trades, particularly in trending markets.
Vortex Indicator Trading Strategies
1. Identifying Trend Reversals
One of the primary uses of the Vortex Indicator is to identify potential trend reversals through the crossovers of the +VI and -VI lines.
Bullish Signal: When the +VI line crosses above the -VI line, it indicates that a new bullish trend may be starting. Traders may consider entering a long position.
Bearish Signal: When the -VI line crosses above the +VI line, it indicates that a new bearish trend may be starting. Traders may consider entering a short position.
Practical Example: Suppose you're trading Bitcoin, and the +VI line crosses above the -VI line. A trader might interpret this as a bullish signal and enter a long position, expecting the price to rise.
2. Trend Following
The Vortex Indicator can also be used to confirm the strength of an existing trend.
Bullish Trend Confirmation: If the +VI line remains consistently above the -VI line, it confirms that the bullish trend is strong and likely to continue. Traders may consider holding or adding to their long positions.
Bearish Trend Confirmation: If the -VI line remains consistently above the +VI line, it confirms that the bearish trend is strong and likely to continue. Traders may consider holding or adding to their short positions.
3. Combining Vortex Indicator with Other Indicators
The Vortex Indicator can be combined with other technical indicators, such as moving averages or the Relative Strength Index (RSI), to enhance trading decisions.
Confirming Signals: For example, if the Vortex Indicator signals a bullish crossover and the RSI indicates that the asset is not overbought, this could strengthen the case for entering a long position.
How to Read the Vortex Indicator
To correctly interpret the Vortex Indicator, traders focus on the following key points:
- +VI Above -VI: Indicates a bullish trend, where buying pressure is dominant. This is typically a signal to consider long positions.
- -VI Above +VI: Indicates a bearish trend, where selling pressure is dominant. This is typically a signal to consider short positions.
- Crossover Points: The points where the +VI and -VI lines cross are critical, as they often signal the start of a new trend.
Comparing Vortex Indicator with Other Trend Indicators
While the Vortex Indicator focuses on identifying the start of new trends, other indicators like the Average Directional Index (ADX) and the Moving Average Convergence Divergence (MACD) also provide insights into trend strength and direction. The Vortex Indicator is unique in its ability to visually represent the directional movement of the market through its oscillating lines, making it particularly useful for traders looking for clear entry and exit signals.
Frequently Asked Questions About the Vortex Indicator
What is a good period setting for the Vortex Indicator? The standard period setting for the Vortex Indicator is 14, but traders can adjust this based on their trading style and the volatility of the asset.
Can the Vortex Indicator be used in all markets? Yes, the Vortex Indicator is versatile and can be used in various markets, including cryptocurrencies, forex, and stocks. Its effectiveness may vary depending on market conditions and the specific strategy being used.
Is the Vortex Indicator better than ADX or MACD? The Vortex Indicator, ADX, and MACD each have their strengths. The Vortex Indicator excels at identifying trend reversals through its crossovers, while ADX measures trend strength and MACD analyzes the relationship between moving averages. The choice depends on the trader's strategy and market conditions.
Vortex Indicator Applications in Forex and Stock Trading
While this article focuses primarily on cryptocurrencies, the Vortex Indicator is also widely used in forex and stock trading. In forex, the Vortex Indicator helps traders identify potential trend reversals and the strength of trends in currency pairs. In the stock market, the Vortex Indicator can be used to evaluate the momentum and direction of individual stocks or indices, aiding traders in making informed decisions about entry and exit points.
Conclusion: Vortex Indicator as a Trend Identification Tool
The Vortex Indicator is a powerful tool for any trader, whether operating in cryptocurrencies, forex, or stocks. Its ability to identify the start of new trends and confirm the strength of existing trends makes it an essential indicator for traders looking to capitalize on trending markets.
Do you want to know which cryptocurrencies are showing ideal setups based on your favorite indicators right now? Visit setupfinder.com and find the best trading opportunities based on your favorite strategy in seconds.
Made by Setup Finder News.