
What is the WMA?
The Weighted Moving Average (WMA) is a type of moving average that assigns greater weight to the most recent data points, making it more responsive to price changes than the Simple Moving Average (SMA). The WMA is particularly useful in fast-moving markets like cryptocurrency, where traders need to react quickly to market trends.
How Does the WMA Work?
The WMA is calculated by multiplying each data point within the selected period by a predetermined weighting factor. The most recent data points receive the highest weighting, while the older data points receive progressively lower weights. The formula for the WMA is:
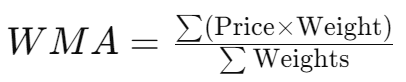
This method gives more significance to recent price movements, allowing the WMA to better reflect short-term price trends.
Why Use the WMA in Cryptocurrency Trading?
The cryptocurrency market is known for its high volatility, making the WMA an ideal tool for traders who want a more accurate reflection of recent price movements. The WMA’s responsiveness to current market conditions can help traders identify potential entry and exit points with greater precision.
WMA Trading Strategies
1. WMA Crossover Strategy
One of the most popular strategies involving the WMA is the crossover strategy. This strategy uses two WMAs of different lengths—a shorter WMA (e.g., 10-day) and a longer WMA (e.g., 50-day).
Bullish Crossover: Occurs when the shorter WMA crosses above the longer WMA, signaling a potential upward trend. Traders may interpret this as a buy signal.
Bearish Crossover: Occurs when the shorter WMA crosses below the longer WMA, signaling a potential downward trend. Traders may interpret this as a sell signal.
Practical Example: Suppose you're trading Litecoin, and the 10-day WMA crosses above the 50-day WMA. A trader might take this as a signal to buy, expecting the price to continue rising.
2. WMA Pullback Strategy
The WMA pullback strategy involves looking for the price to pull back to the WMA during a trend. This strategy works well in trending markets where the WMA acts as a dynamic support or resistance level.
Bullish Pullback: When the price pulls back to the WMA and then resumes the upward trend, traders may see this as a buying opportunity.
Bearish Pullback: When the price rallies up to the WMA and then resumes the downward trend, traders may see this as a selling opportunity.
How to Read the WMA
To correctly read the WMA, traders often use it in conjunction with other indicators or WMAs of different lengths. Commonly used WMAs include the 10-day, 50-day, and 200-day WMAs, each providing insights into short-term, medium-term, and long-term trends, respectively.
- Short-Term WMA (e.g., 10-day): Highly responsive to recent price changes, ideal for short-term trading.
- Medium-Term WMA (e.g., 50-day): Provides a more balanced view of the trend, useful for confirming signals.
- Long-Term WMA (e.g., 200-day): Helps identify the overall market trend and key support or resistance levels over a longer period.
Comparing WMA with Other Technical Indicators
While the WMA is similar to the SMA and EMA, its key difference lies in the weighting of recent prices. The WMA assigns greater importance to the most recent data, making it more sensitive to price changes than the SMA but potentially less prone to false signals than the EMA. Compared to other indicators like the RSI or Bollinger Bands, the WMA provides a clear visual representation of the trend, making it easier to identify trading opportunities.
Frequently Asked Questions About the WMA
What is the best WMA length to use? The best WMA length depends on your trading strategy. Shorter WMAs (e.g., 10-day) are better for short-term trades, while longer WMAs (e.g., 50-day or 200-day) are better for identifying long-term trends.
Can the WMA be used in all markets? Yes, the WMA is versatile and can be used in various markets, including cryptocurrencies, forex, and stocks. Its effectiveness, however, may vary depending on market conditions and the specific strategy you use.
How is the WMA calculated? The WMA is calculated by applying different weights to each data point within the selected period, with more recent data receiving higher weights. This results in a moving average that is more responsive to recent price movements.
WMA Applications in Forex and Stock Trading
Although this article focuses primarily on cryptocurrencies, the WMA is also widely used in forex and stock trading. In forex, the WMA helps traders identify the strength of a currency pair and potential reversal points. In the stock market, the WMA can be used to assess the momentum of a stock or an index, helping traders make informed decisions.
Conclusion: The WMA as a Crucial Tool for Active Traders
The WMA is an essential tool for any trader, whether operating in cryptocurrencies, forex, or stocks. Its ability to quickly adapt to price changes makes it invaluable for identifying trends and potential trading opportunities.